A scraper breaks for reasons that are not in your code: the site is redesigned, moves a URL, turns on a firewall or stops publishing its feed. None of those changes come with a warning, and if nobody catches them, the first symptom is a user asking why data is missing.
We maintain an aggregation platform with more than 35 public sources. This is what we have set up to find out before the user does, ordered by how much each piece has helped us.
Three test levels, each with its own job
| Level | Against what | When it runs | What it catches |
|---|---|---|---|
| Unit | A saved snapshot of the real response | On every PR | That our parser still understands the format |
| Integration | Test database | On every PR | That normalizing and saving neither duplicates nor drops fields |
| Smoke | The live site | Every three days in CI | That the source is still there, with the structure we expect |
The split matters because the first two should never fail because of a third party. If the unit test called the live site, a source redesign would block any PR, even one with nothing to do with scraping.
The unit test uses a saved real response
When we add a source, we save a real response as a fixture: the API JSON, the feed XML or the listing HTML. The test processes that file and checks the output field by field. Every odd format that shows up later (an empty price, a date with no year, a category under a different name) is added to the fixture as a new case.
The smoke test calls the real site
There is one per source and it is short. For an HTML source:
describe('Source X — smoke', () => {
  let html: string;

  beforeAll(async () => {
    const res = await axios.get(URL, { timeout: 30_000, headers: DEFAULT_HEADERS });
    html = res.data;
  });

  it('returns HTML', () => expect(html).toContain('<html'));

  it('has cards in the listing', () => {
    const $ = cheerio.load(html);
    expect($('.views-row').length).toBeGreaterThanOrEqual(1);
  });

  it('the first card has a title', () => {
    const $ = cheerio.load(html);
    expect($('.views-row').first().find('h2 a, h3 a').text().trim()).not.toBe('');
  });
});
It does not check how many items there are, because that changes every day. It checks that the structure the scraper depends on still exists. And in the header of each file we write down what to look at if it fails: the URL, the site’s CMS and where the selectors live in the configuration.
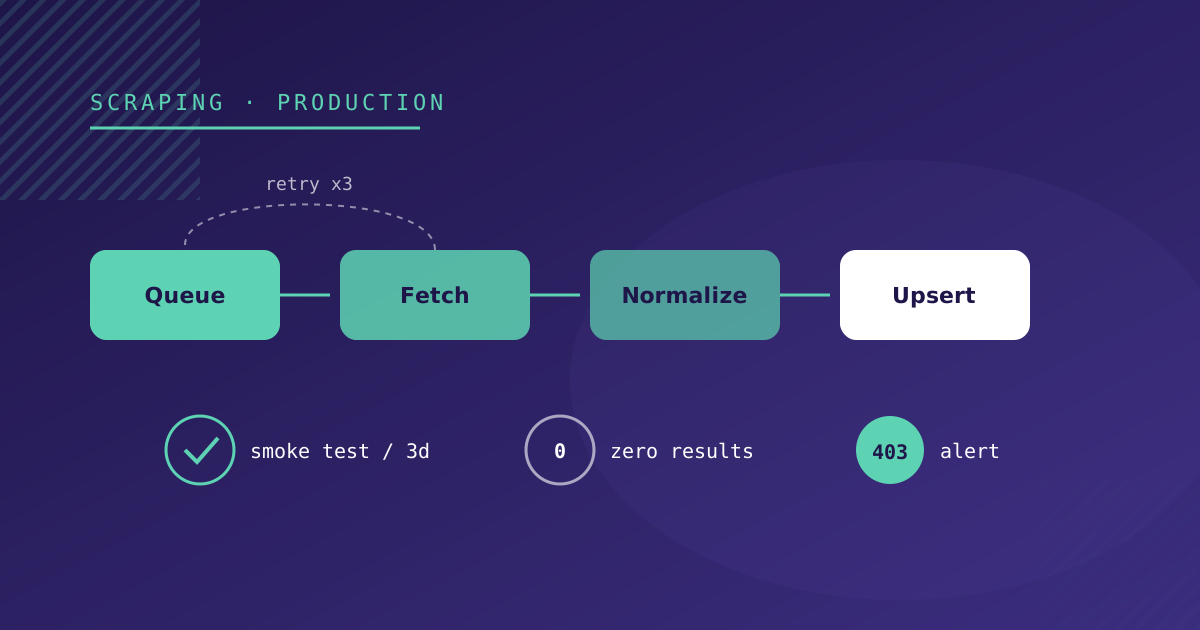
They run on GitHub Actions every three days (cron: '0 8 */3 * *') and can also be triggered by hand. Three days is our compromise between not hammering the source sites and not taking a week to find out about a redesign.
Every run leaves a trace
Each source is a job in a BullMQ queue on Redis. A scheduler checks every hour which sources are due according to their frequency and enqueues them. If a run fails, it is retried three times with exponential backoff starting at 30 seconds. If we trigger it by hand from the dashboard, it gets a single attempt: whoever triggers it manually is watching and wants to see the error right away.
Each run stores a record:
- status (
RUNNING,SUCCESS,FAILED) - items found and new items
- error message, if any
- start and end time
With that you can quickly answer “since when has nothing come in from this source?”, which is the first question when something fails.
The failure that throws no error: zero results
This is the case that took us longest to see. A site changes the CSS class of its cards, the selector finds nothing and the scraper finishes successfully: zero items, no error, status SUCCESS.
That is why the daily report does more than separate successes from failures. It groups sources into four lists:
- Successful, with items found and new items.
- Failed, with the error.
- Zero results, even if they finished fine.
- Not run in the period, which usually means the source is disabled or the scheduler did not enqueue it.
The third list is the one that has uncovered the most problems for us. A source that always brings between 10 and 20 items and one day brings zero is broken, whatever the status says.
An alert that says what to check
When a run really fails, an email goes to the team. We have extended it every time an alert forced us to open five tabs to understand it. Today it includes:
- source, strategy and configuration
- HTTP status and the first characters of the response
- error stack trace
- the last five runs of that source
- a suggestion based on the type of error
The suggestions are simple rules on the HTTP status, the error message and the source’s strategy:
| Signal | Suggestion |
|---|---|
| 403 | The site blocks automated requests: check the User-Agent, move to a headless browser or to an unblocking route |
| 404 | The URL has changed |
| 429 | Rate limiting: lower the frequency or add delays |
| 500, 502, 503 | The source site is down; check it by hand before digging further |
| timeout, ECONNABORTED | Slow or unreachable site; review the timeout |
| ENOTFOUND, ECONNREFUSED | Domain changed or site down |
| HTML parsing error | The structure has changed: review the selectors |
| JSON error on an API | The format has changed: review the field mapping |
With that table, most alerts get resolved without opening the code. Someone who did not write the scraper knows where to start.
One document per source
Each source has a Markdown file with its configuration, a sample of the data format, known issues and pending work. We require it just like the test: no document, no new source.
The document exists because every site has its quirks, and the second time someone investigates them, time is already being wasted. Real examples from our known-issues table:
- the price arrives as an empty string and has to be treated as “no price”, not as 0
- the “free” field comes as a number,
0or1 - the API URL redirects to another domain and the redirect has to be followed
- the site returns 403 even though its robots.txt allows access
- the feed mixes content types and they have to be filtered by the
guidprefix
What breaks and is not the source
Not every failure comes from outside. One of our headless browser sources went down because an environment was deployed without the variable that points to the Chromium binary. The error said Executable doesn't exist at /root/.cache/ms-playwright/..., and the smoke test, which uses an HTTP client, stayed green because the site was fine.
Since then we treat it as part of the deployment: the Docker image installs Chromium, sets the path through an environment variable, and we document it on the strategy’s page. If the environment cannot carry a browser, the alternative is connecting to a remote one; that is what we do with Bright Data’s Scraping Browser on sources that also block by IP.
Operations checklist
- Unit test with a saved real response, on every PR.
- Smoke test against the live site, scheduled and kept separate from PRs.
- Queue with retries and exponential backoff; a single attempt on manual runs.
- Log per run with items found, new items and error.
- Daily report that singles out sources with zero results.
- Alert with HTTP status, response, history and a suggestion.
- One document per source with its known issues.
Before this, we explained how we choose the strategy for each source. And if you have scrapers that break without anyone noticing, our web scraping service starts by setting up this monitoring.