
A computer vision project developed by Soamee for an industrial client, now in production on assembly lines with real machinery. A confidentiality agreement prevents us from naming the client.
In production, and the public demo
What you see on this page is a replica: we trained and evaluated it on a public dataset. The screens, images and metrics below come from that dataset. The client’s system runs in production on assembly lines and, under the confidentiality agreement, we cannot show anything from it.
One possible setup uses a vibratory screw feeder, a conveyor, head and profile cameras and a PLC-controlled pneumatic rejector. This is an example of compatible machinery, not an identification of the client’s equipment.
The images come from the M2 Screw Defect Detection Dataset, published by R. P. Prastio and R. W. Indrawan (Airlangga University) under CC BY 4.0: 5,536 photos of M2 screws taken at an optical inspection station.
The challenge
On a screw production line, inspection is usually done by sampling: a few parts per batch are pulled and checked by hand or with a gauge. An M2 screw is two millimetres across, and a defect on its thread or head is hard to see without magnification.
The dataset photographs each screw twice: the head from above on a black background, and the thread side-on against backlight. Each photo is labelled OK or NG (defective). The NG photos show burrs, flattened crests, deformed or badly stamped heads and stains on the metal.
How we solved it
Automatic crop
In the original photo the screw takes up very little of the frame. Shrink the whole image to feed it to a neural network and the defect disappears. So the first step locates the screw (the bright head on the black background, or the dark silhouette against the light) and crops a square around it.
One classifier per region
We trained two ResNet-18 networks, one for the head and one for the thread, starting from the public ImageNet weights. Each learns from 1,700 photos and uses another 300 to pick the best version during training. The authors’ test photos (536 head, 1,000 thread) stay untouched until the end.
Where the model looked
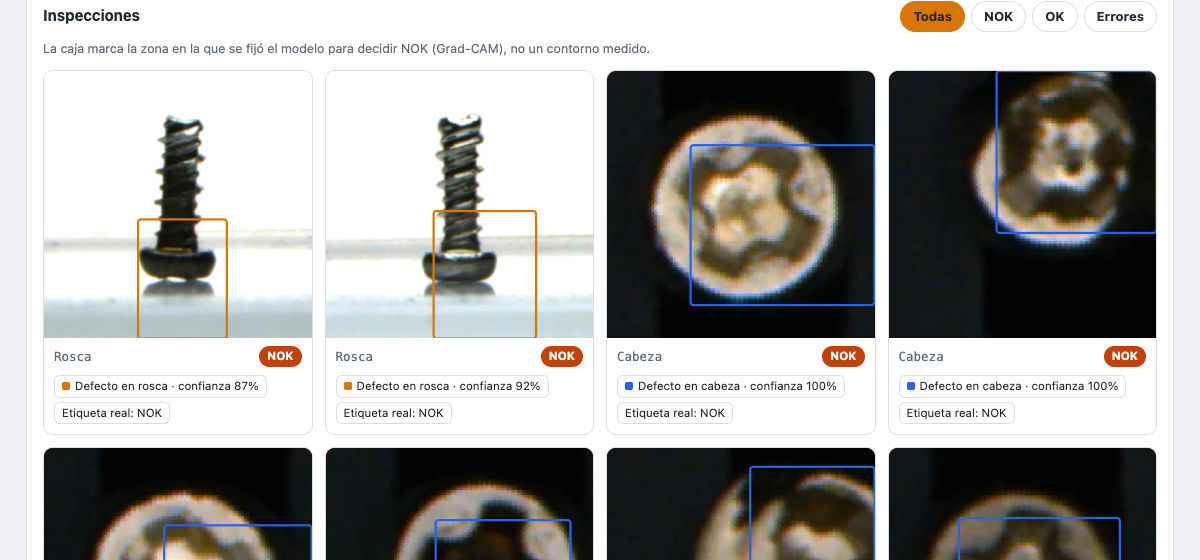
A network that says “NG” without explaining why is hard to defend to a quality manager. For every rejected part we compute a Grad-CAM map, which highlights the area of the image that weighed most in the decision. The dashboard marks it with a box. It is not a measured outline of the defect: it is a hint telling the operator where to look.
Architecture
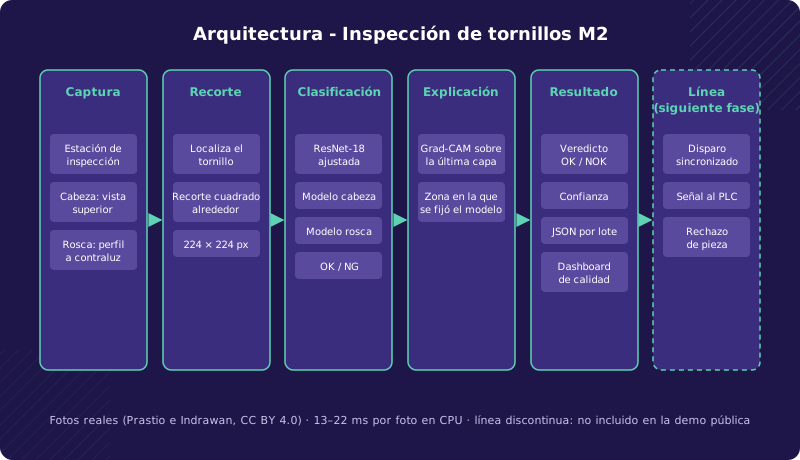
The model exports one JSON file per batch, which feeds a static dashboard: photos inspected, rejected parts by region, model decisions against the real label, and the inspection gallery, mistakes included.
Public benchmark results
Evaluated on the authors’ 1,536 test photos:
| Region | Accuracy | Catches NG | NG precision | Good parts rejected | Photos |
|---|---|---|---|---|---|
| Head | 95.9% | 95.7% | 96.4% | 3.9% | 536 |
| Thread | 91.8% | 85.6% | 97.7% | 2.0% | 1,000 |
Overall it gets 93.2% of photos right and takes between 13 and 22 ms per photo on a laptop with no GPU.
The head model works well: of 279 defective screws, 12 slip through, and of 257 good ones it rejects 10. The thread is harder. It rejects very few good screws (10 out of 500), but lets 72 of 500 defective ones through. On a real line that is the number to bring down, even at the cost of rejecting a few extra good screws: lower the decision threshold, add a second view of the thread or improve the lighting of the profile.
The inspection gallery shows these mistakes too, with the real label next to the model’s verdict.
What gets built on top
The model is the core, but in a factory people use it through screens. These three run on the results of the test batch.
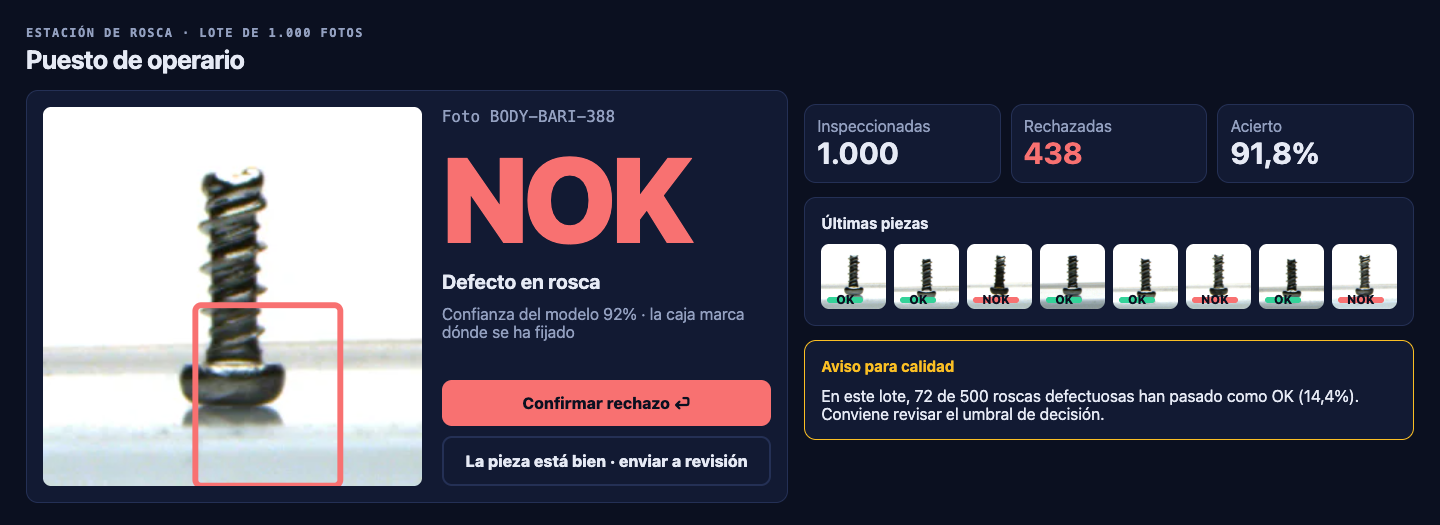
Operator station. The verdict is readable from two metres away, with the area the model focused on and its confidence. The operator confirms the rejection with one key or sends the part to review if they think it is fine. Quality gets an alert when the share of defective parts passing as good goes above what is acceptable, like the 14.4% on the thread in this batch.
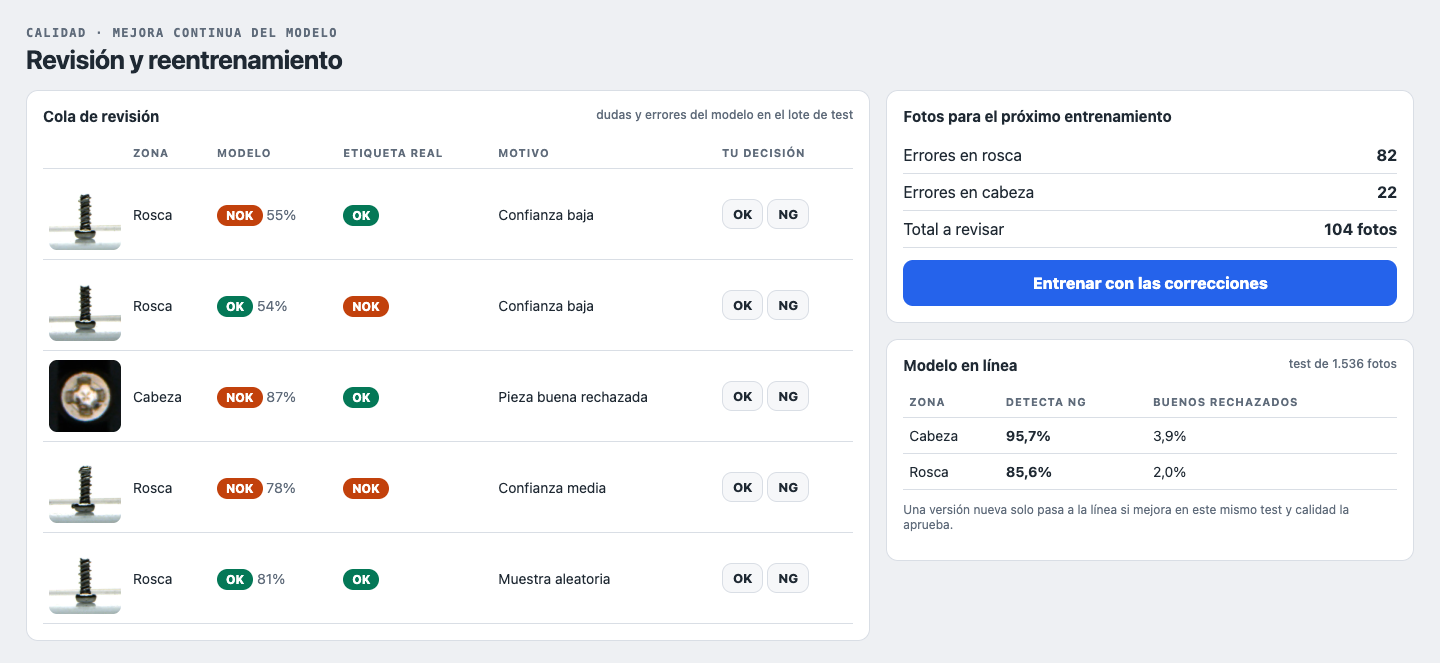
Review and retraining. Low-confidence parts and model mistakes form a queue that quality reviews: 104 photos in this batch, 82 thread and 22 head. They train a new version, which only replaces the one on the line if it does better on the same test.
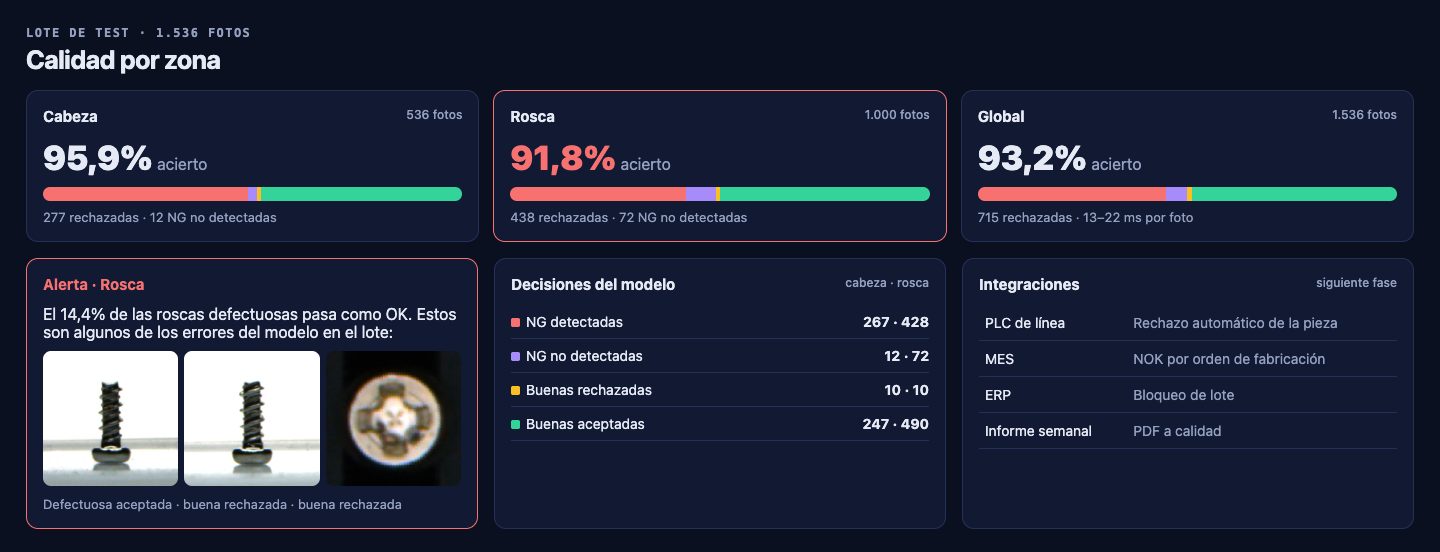
Quality by region. Accuracy and rejections for head and thread, the breakdown of model decisions and the specific mistakes to review. The next phase is wiring the rejection to the line’s PLC and sending NOK parts to the MES and ERP. We already have that PLC integration running in production on a project we cannot publish for confidentiality reasons.
Before taking it to another environment
- Photos from the customer’s line: with their camera, their lighting and their defects. A model trained on another station’s photos cannot be installed as is.
- A threshold agreed with quality: what a defective part reaching the customer costs compared with a good part thrown away. That sets the cut-off point.
- Line integration: camera triggering synchronised with the conveyor and a signal to the PLC to divert rejected parts.
We always start with an on-site feasibility phase: a few weeks photographing real parts before committing to detection figures.
Tech stack
| Component | Technology |
|---|---|
| Crop | Python, OpenCV |
| Classification | PyTorch, fine-tuned ResNet-18 (head and thread) |
| Explanation | Grad-CAM |
| Evaluation | Authors’ test photos, unused in training |
| Dashboard | Static HTML, Chart.js |
Photos: M2 Screw Defect Detection Dataset, R. P. Prastio and R. W. Indrawan, Airlangga University (2026), doi:10.17632/2y6mcsyrpy.2, CC BY 4.0. Cropped for training and the gallery.
How we work
Every project follows our artisan process, adapted to each client's specific needs.
Discovery & Requirements
Deep dive into business, users and objectives. Ideation workshops, market research and MVP scope definition.
Design & Architecture
Wireframes, interactive prototypes and technical architecture. Client validation before writing code.
Development & Testing
2-week sprints with demos. CI/CD, code review and continuous testing. Feedback every iteration.
Delivery & Evolution
Production deploy, monitoring and support. Post-launch metrics and continuous improvement roadmap.