Real data about your projects. Not gut feeling.
Dashboard, profitability, utilisation, burn rate, scope creep and team scoring. Analytics that tells you what to do, not just what happened.
Request a free demoEverything at a glance. Updated in real time.
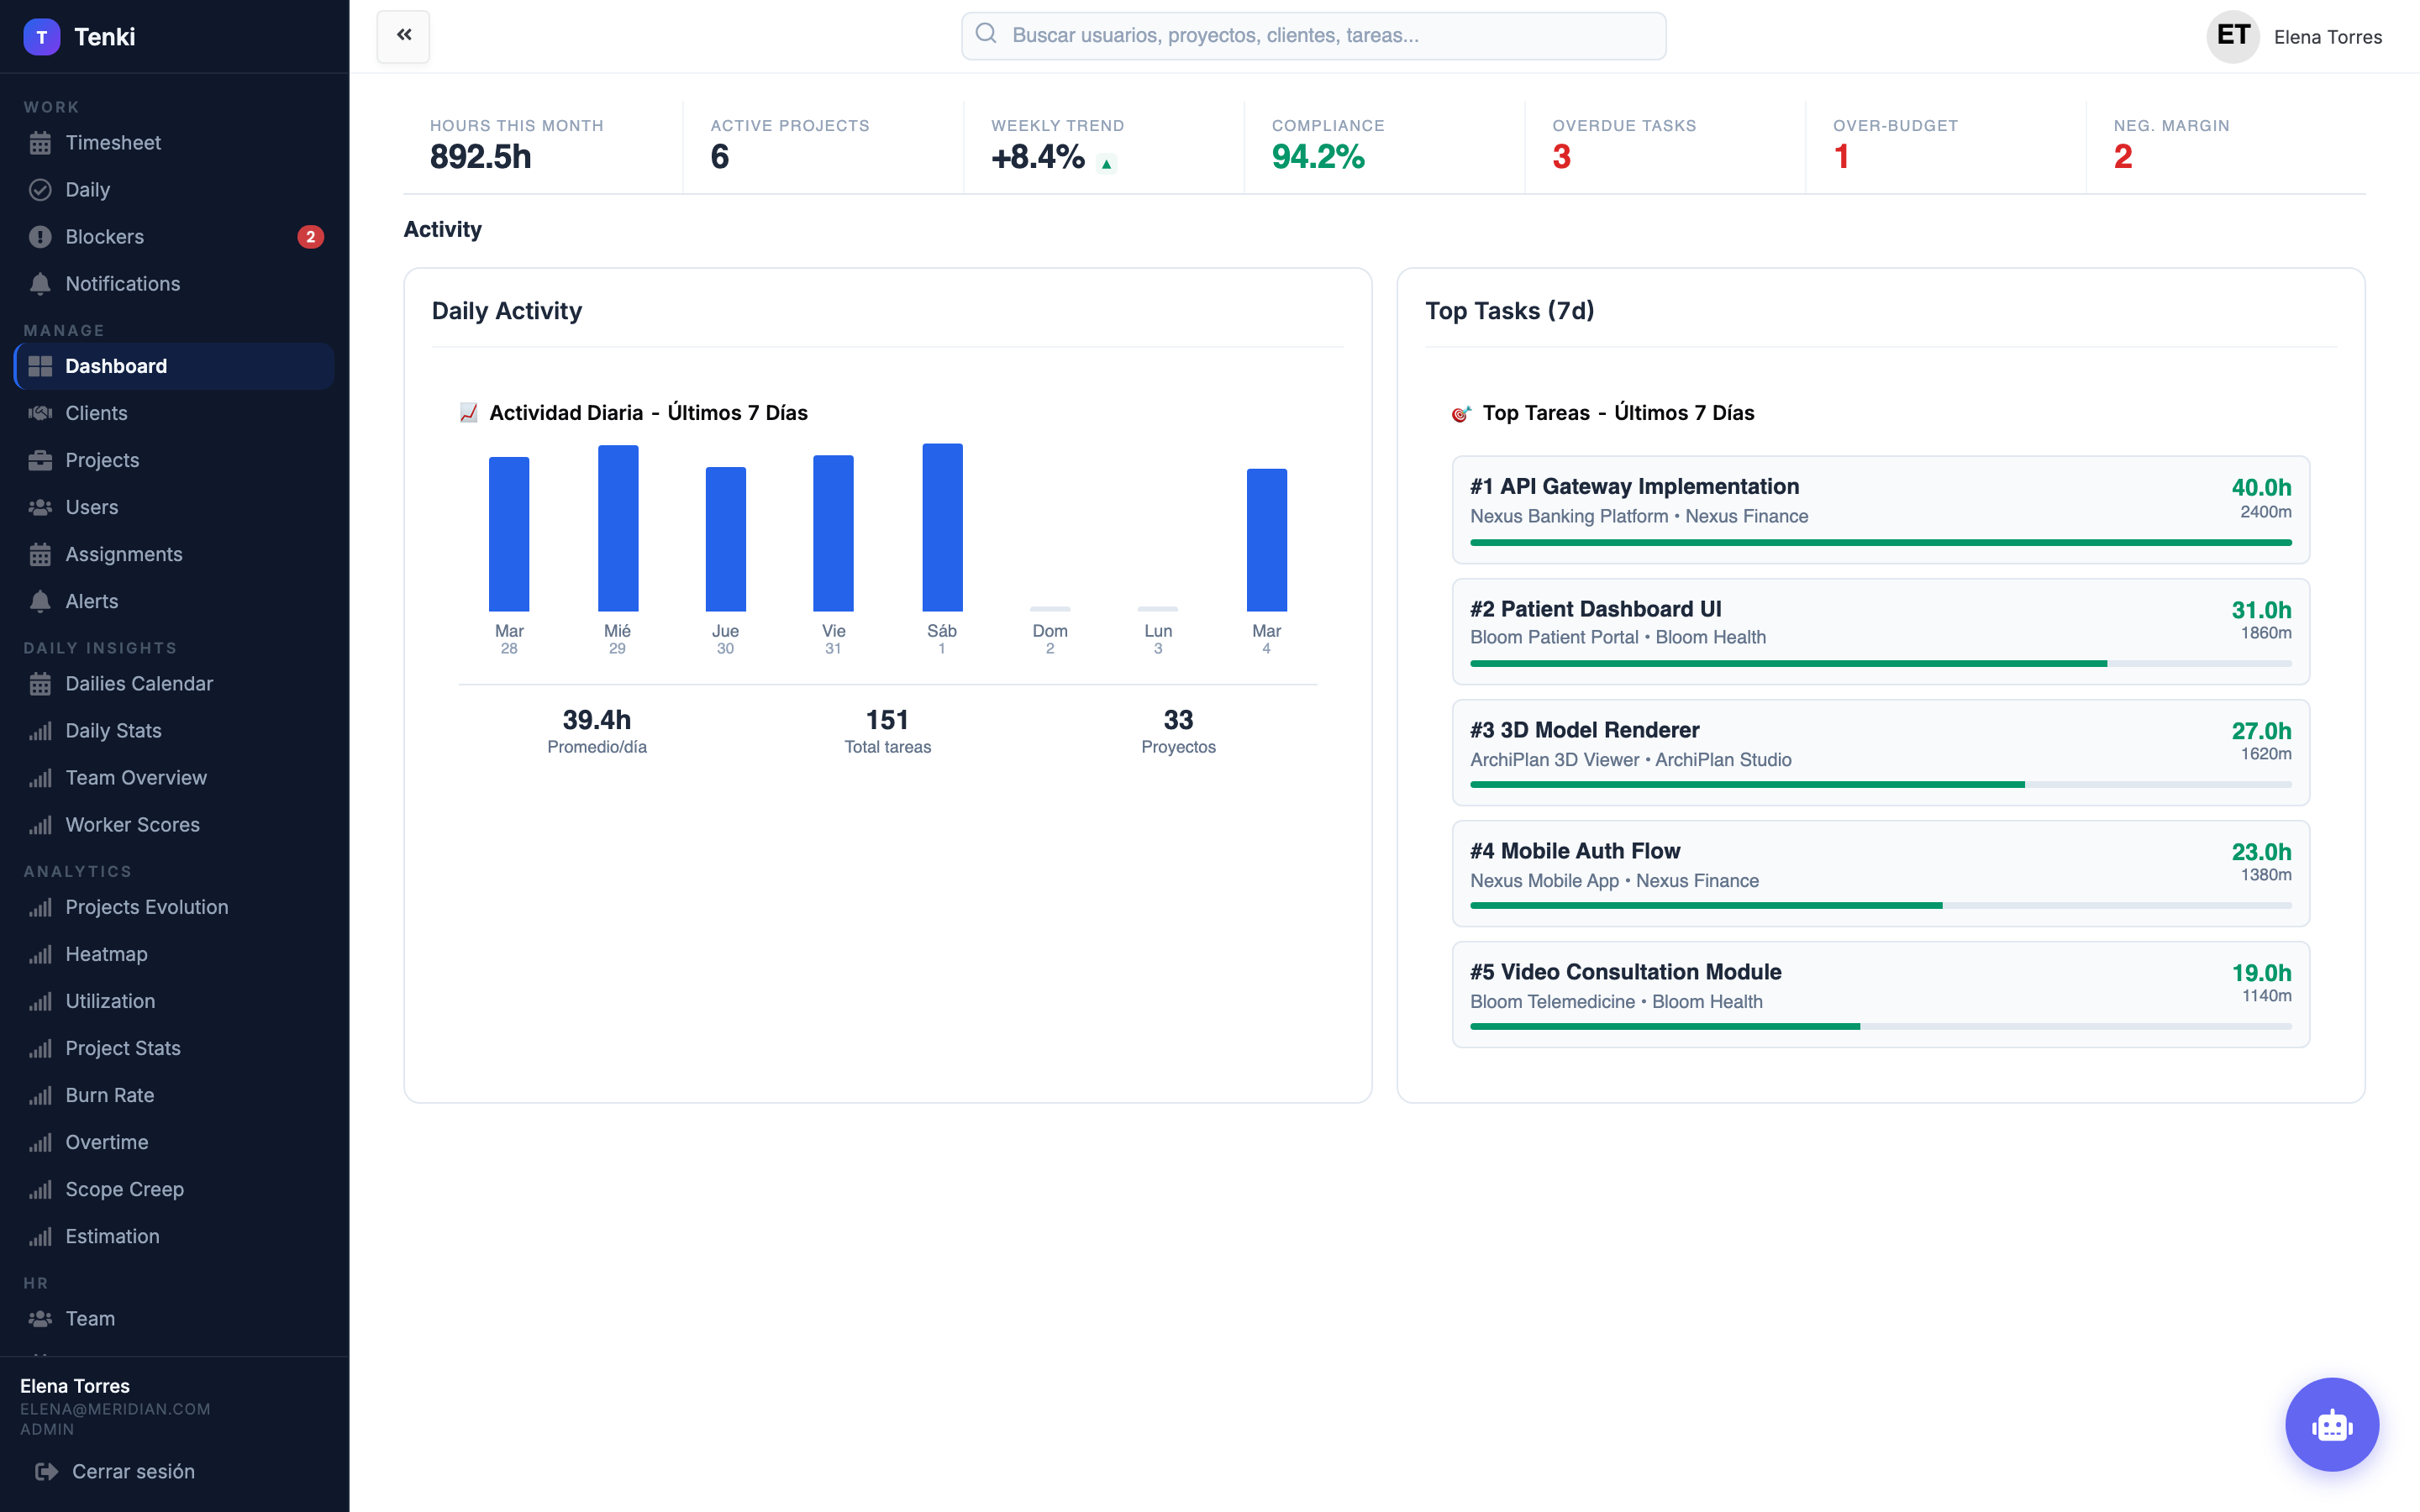
Executive view: hours this month, active projects, weekly trend, compliance %, overdue tasks, over-budget projects, negative margin count. Daily activity chart. Top tasks by hours. Everything at a glance, updated in real time.
- Executive KPIs in real time
- Daily activity chart
- Top tasks and projects by hours
- Filters by period
Revenue vs actual cost. No surprises on delivery.
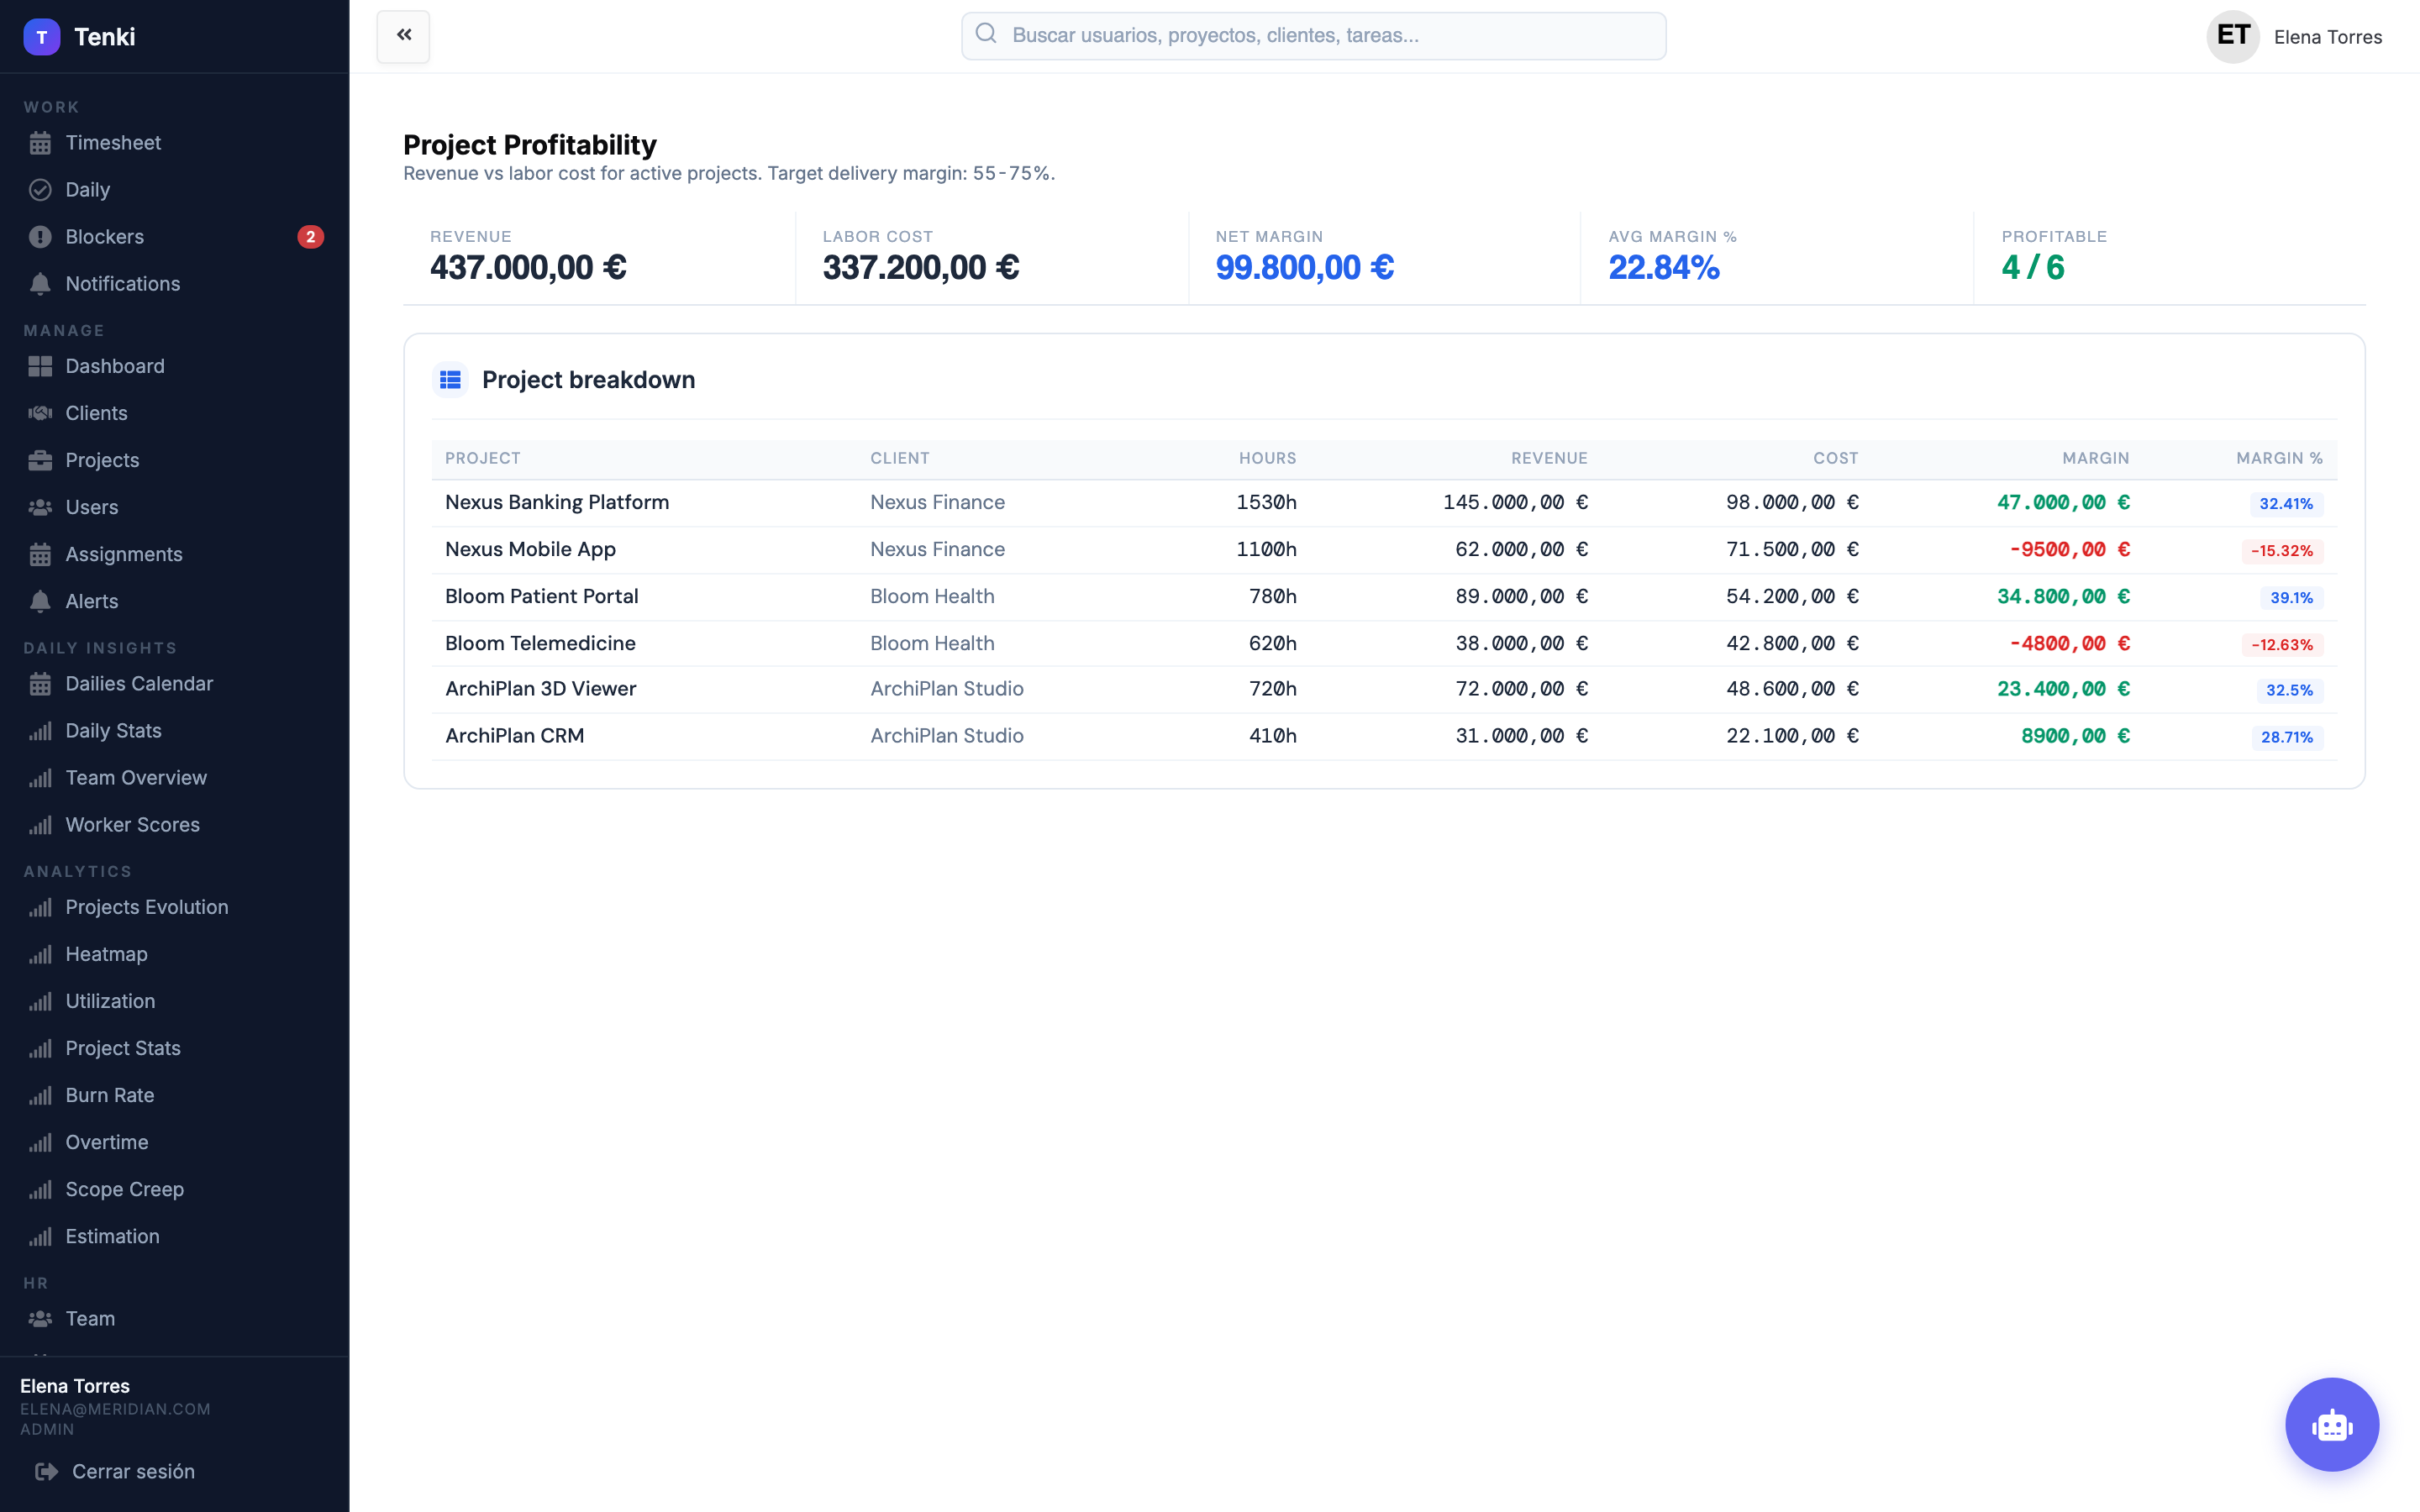
Revenue vs actual cost per project. Margin in € and %. Traffic-light colours (green OK, red bleeding). Table sortable by revenue, cost and margin. Breakdown: hours × hourly cost of each assigned person. Spot projects losing money before you deliver.
- Revenue vs actual cost
- Margin in € and % with colour coding
- Breakdown per person
- Negative-margin alerts
Who has capacity. Who needs help.
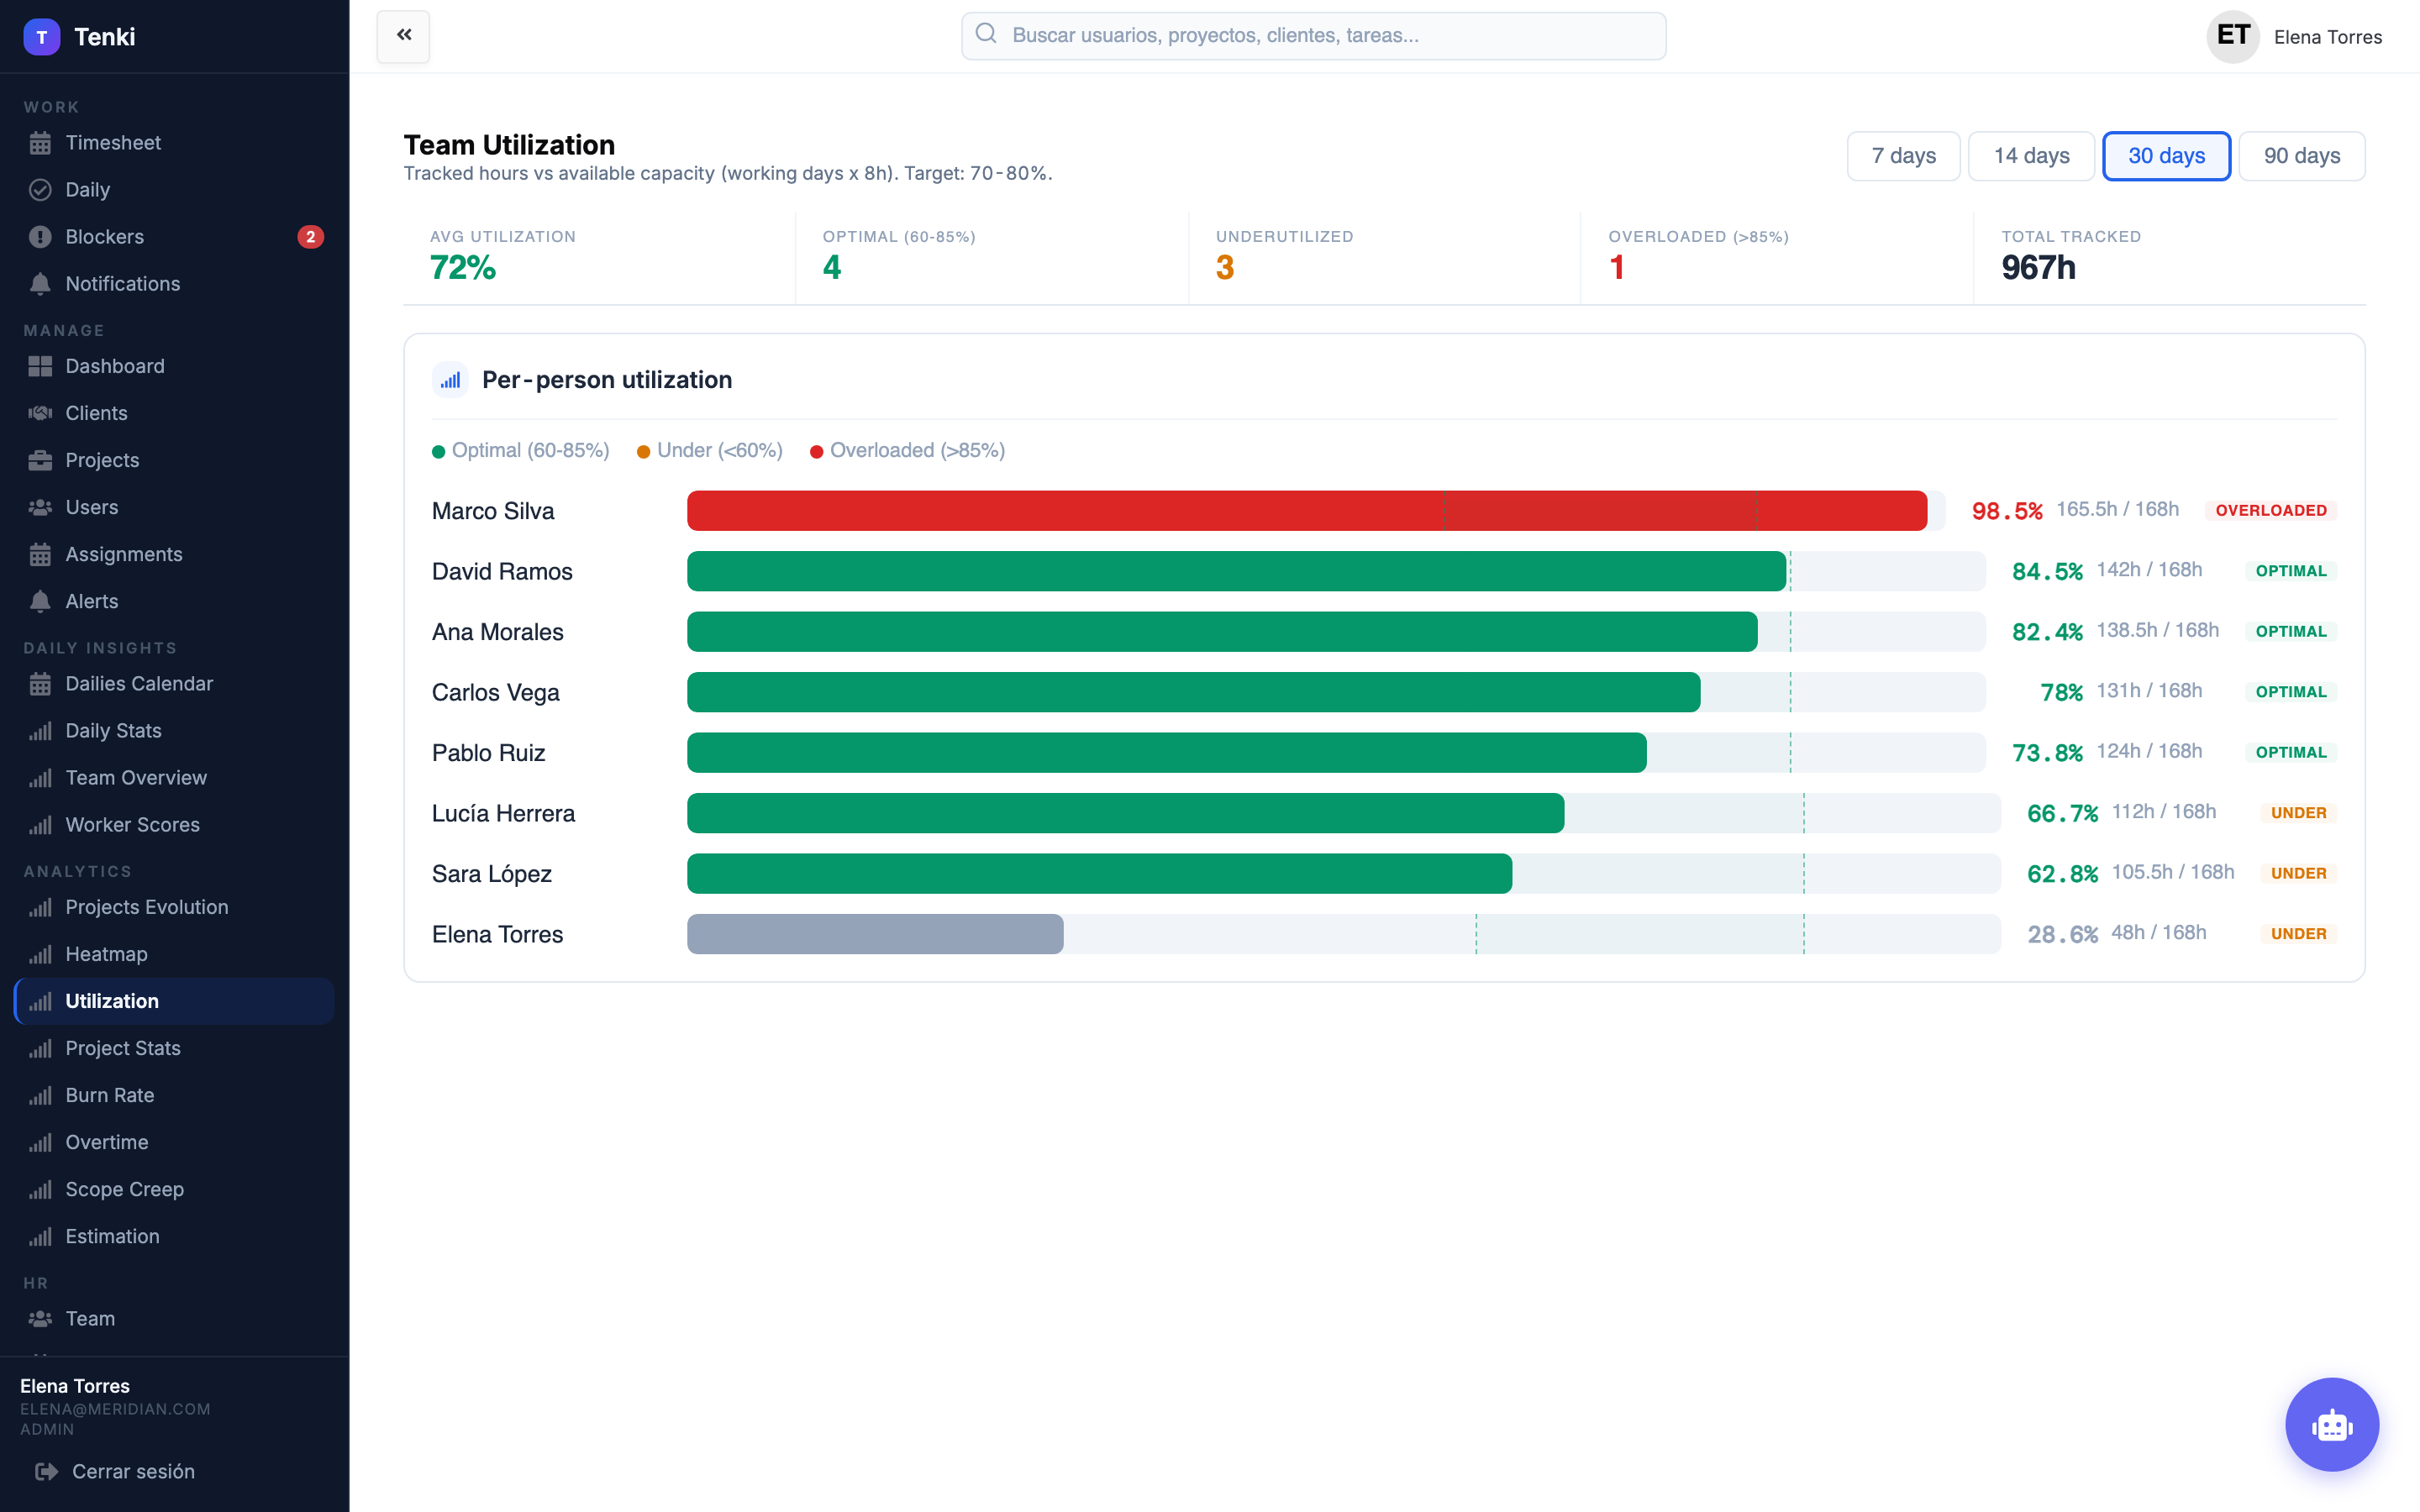
A workload bar per person. Configurable target (70-80% by default). Statuses: optimal, under, overloaded. Periods: 7/14/30/90 days. Total hours tracked. Spot who has capacity and who needs help.
- Bar per person with target
- 4 analysis periods
- Total hours tracked
- Overload detection
One-to-ones with data. Not opinions.
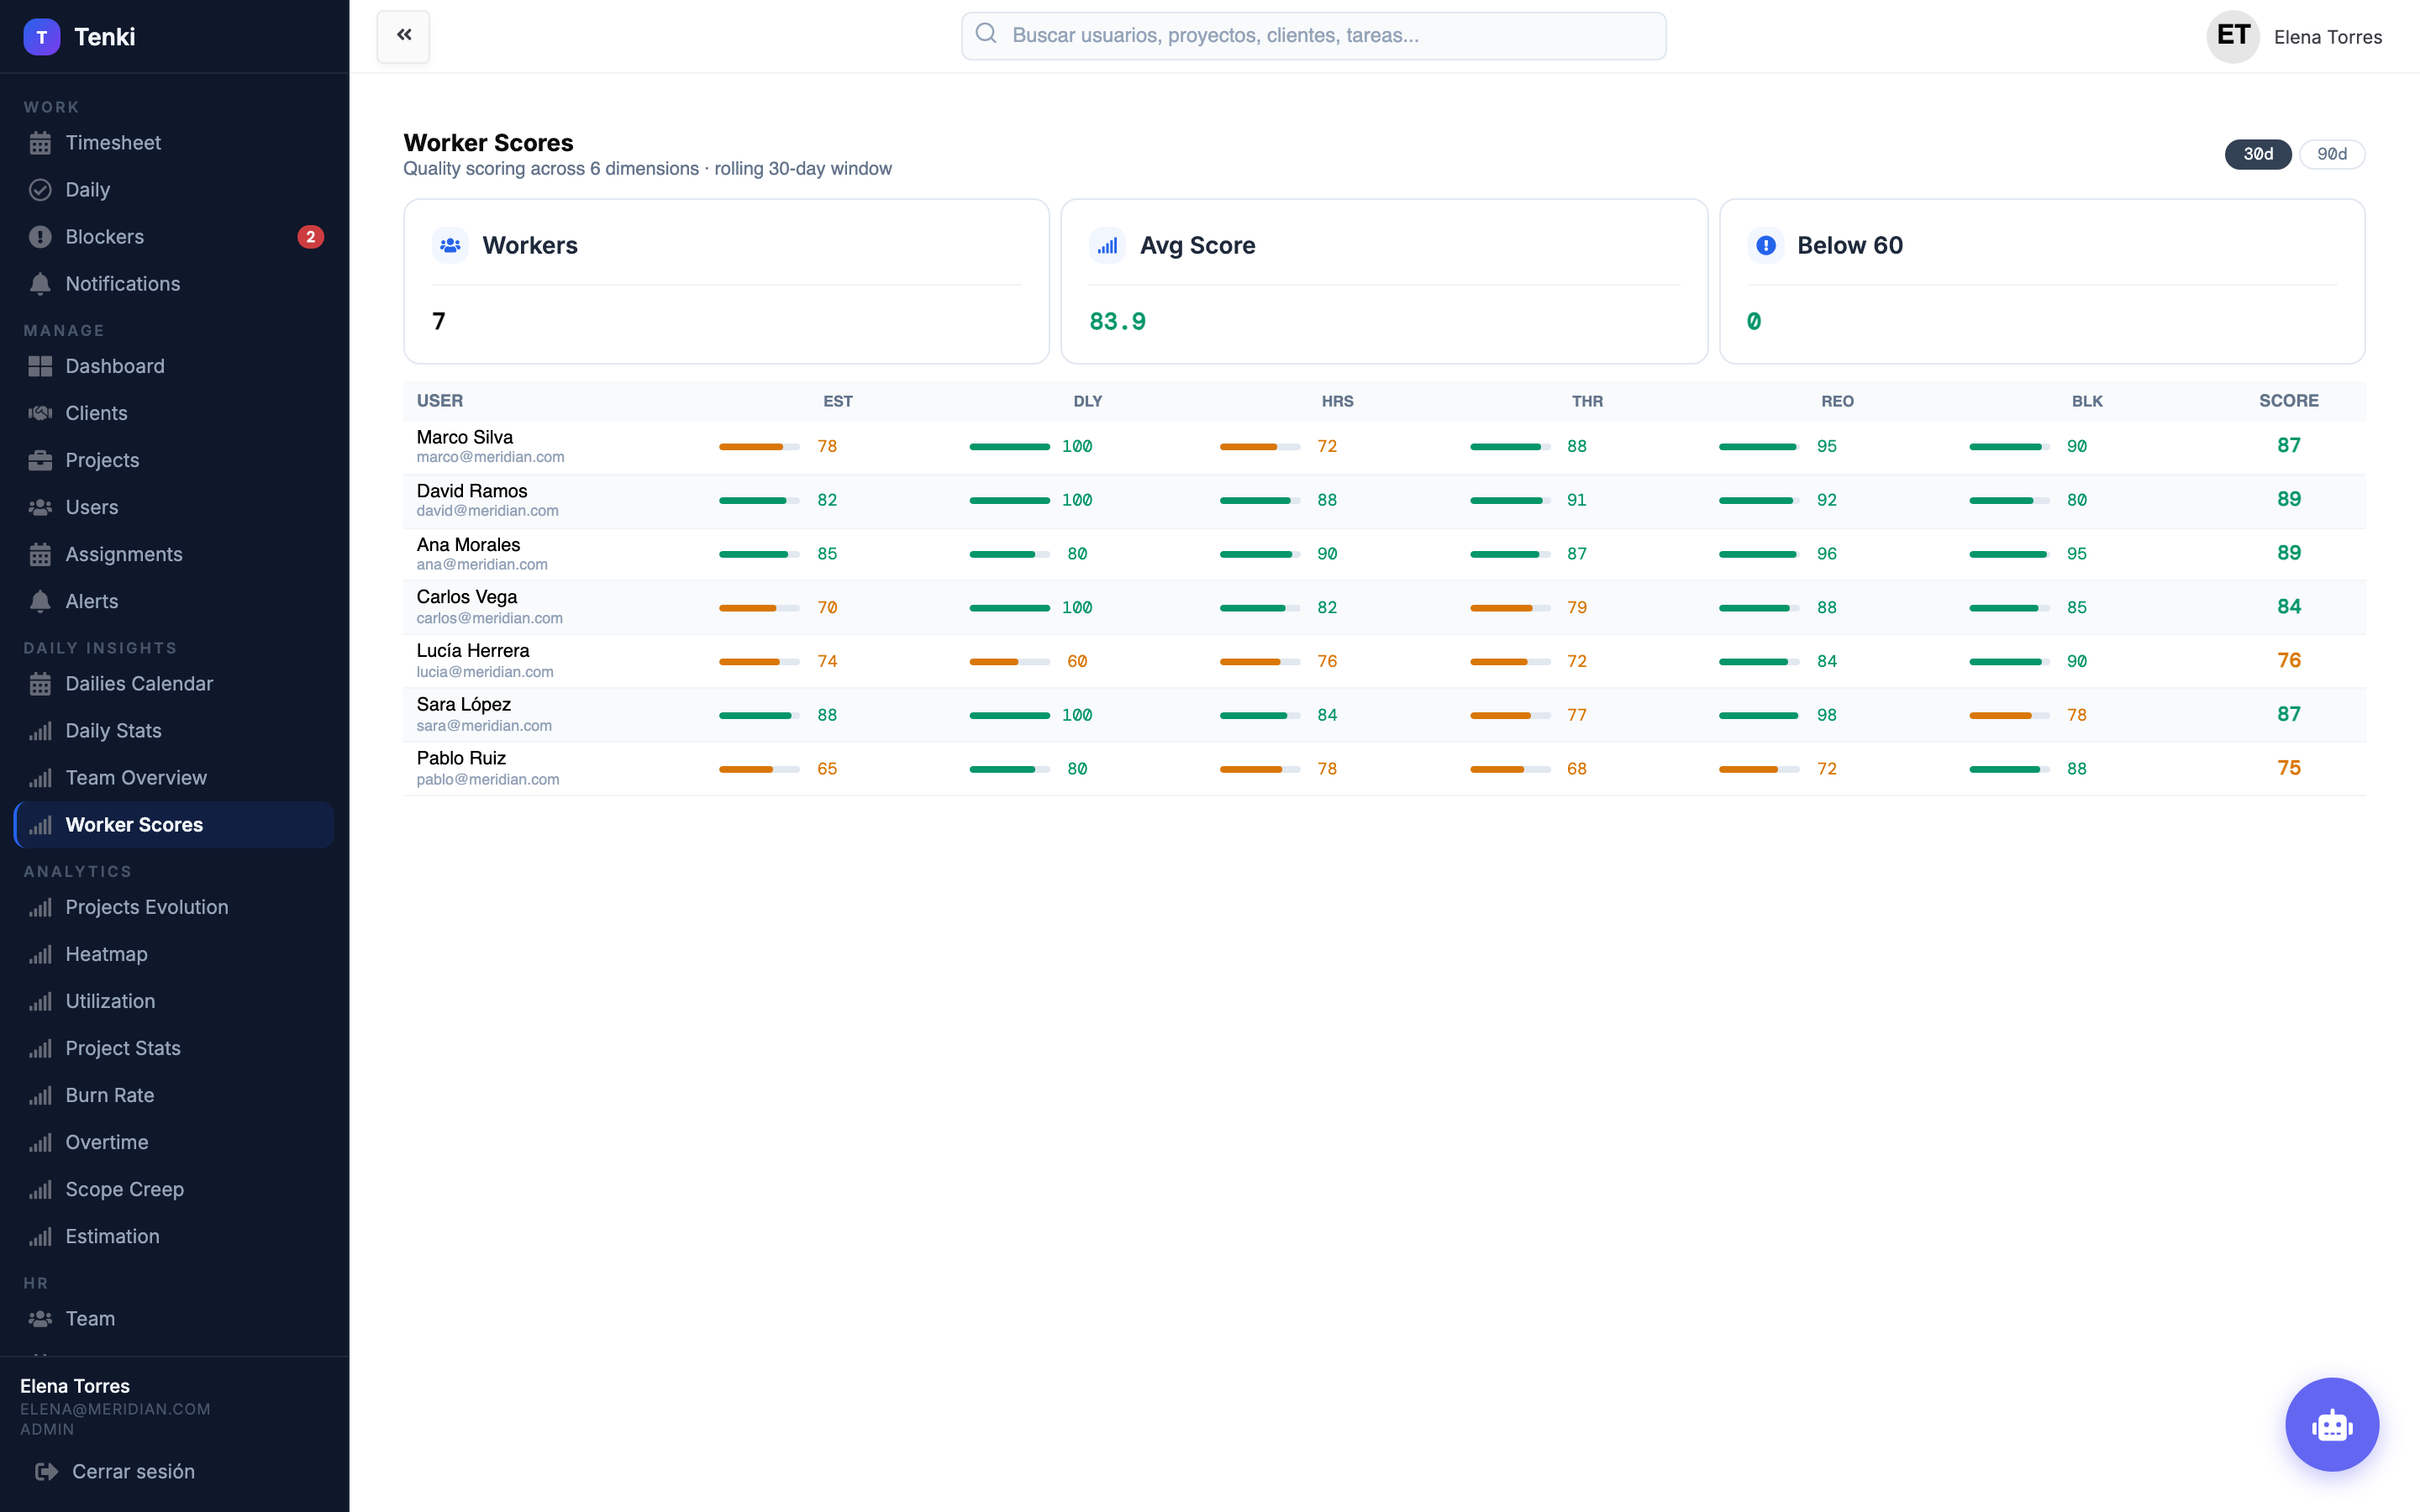
Automatic scoring per person: compliance (do they log their hours?), how hours are spread across projects, weekly trend. Spot patterns without micromanaging. For one-to-ones based on data, not opinions.
- Automatic score per person
- Compliance tracking
- Hour distribution
- Weekly trend
Prevent burnout with data. Not hunches.
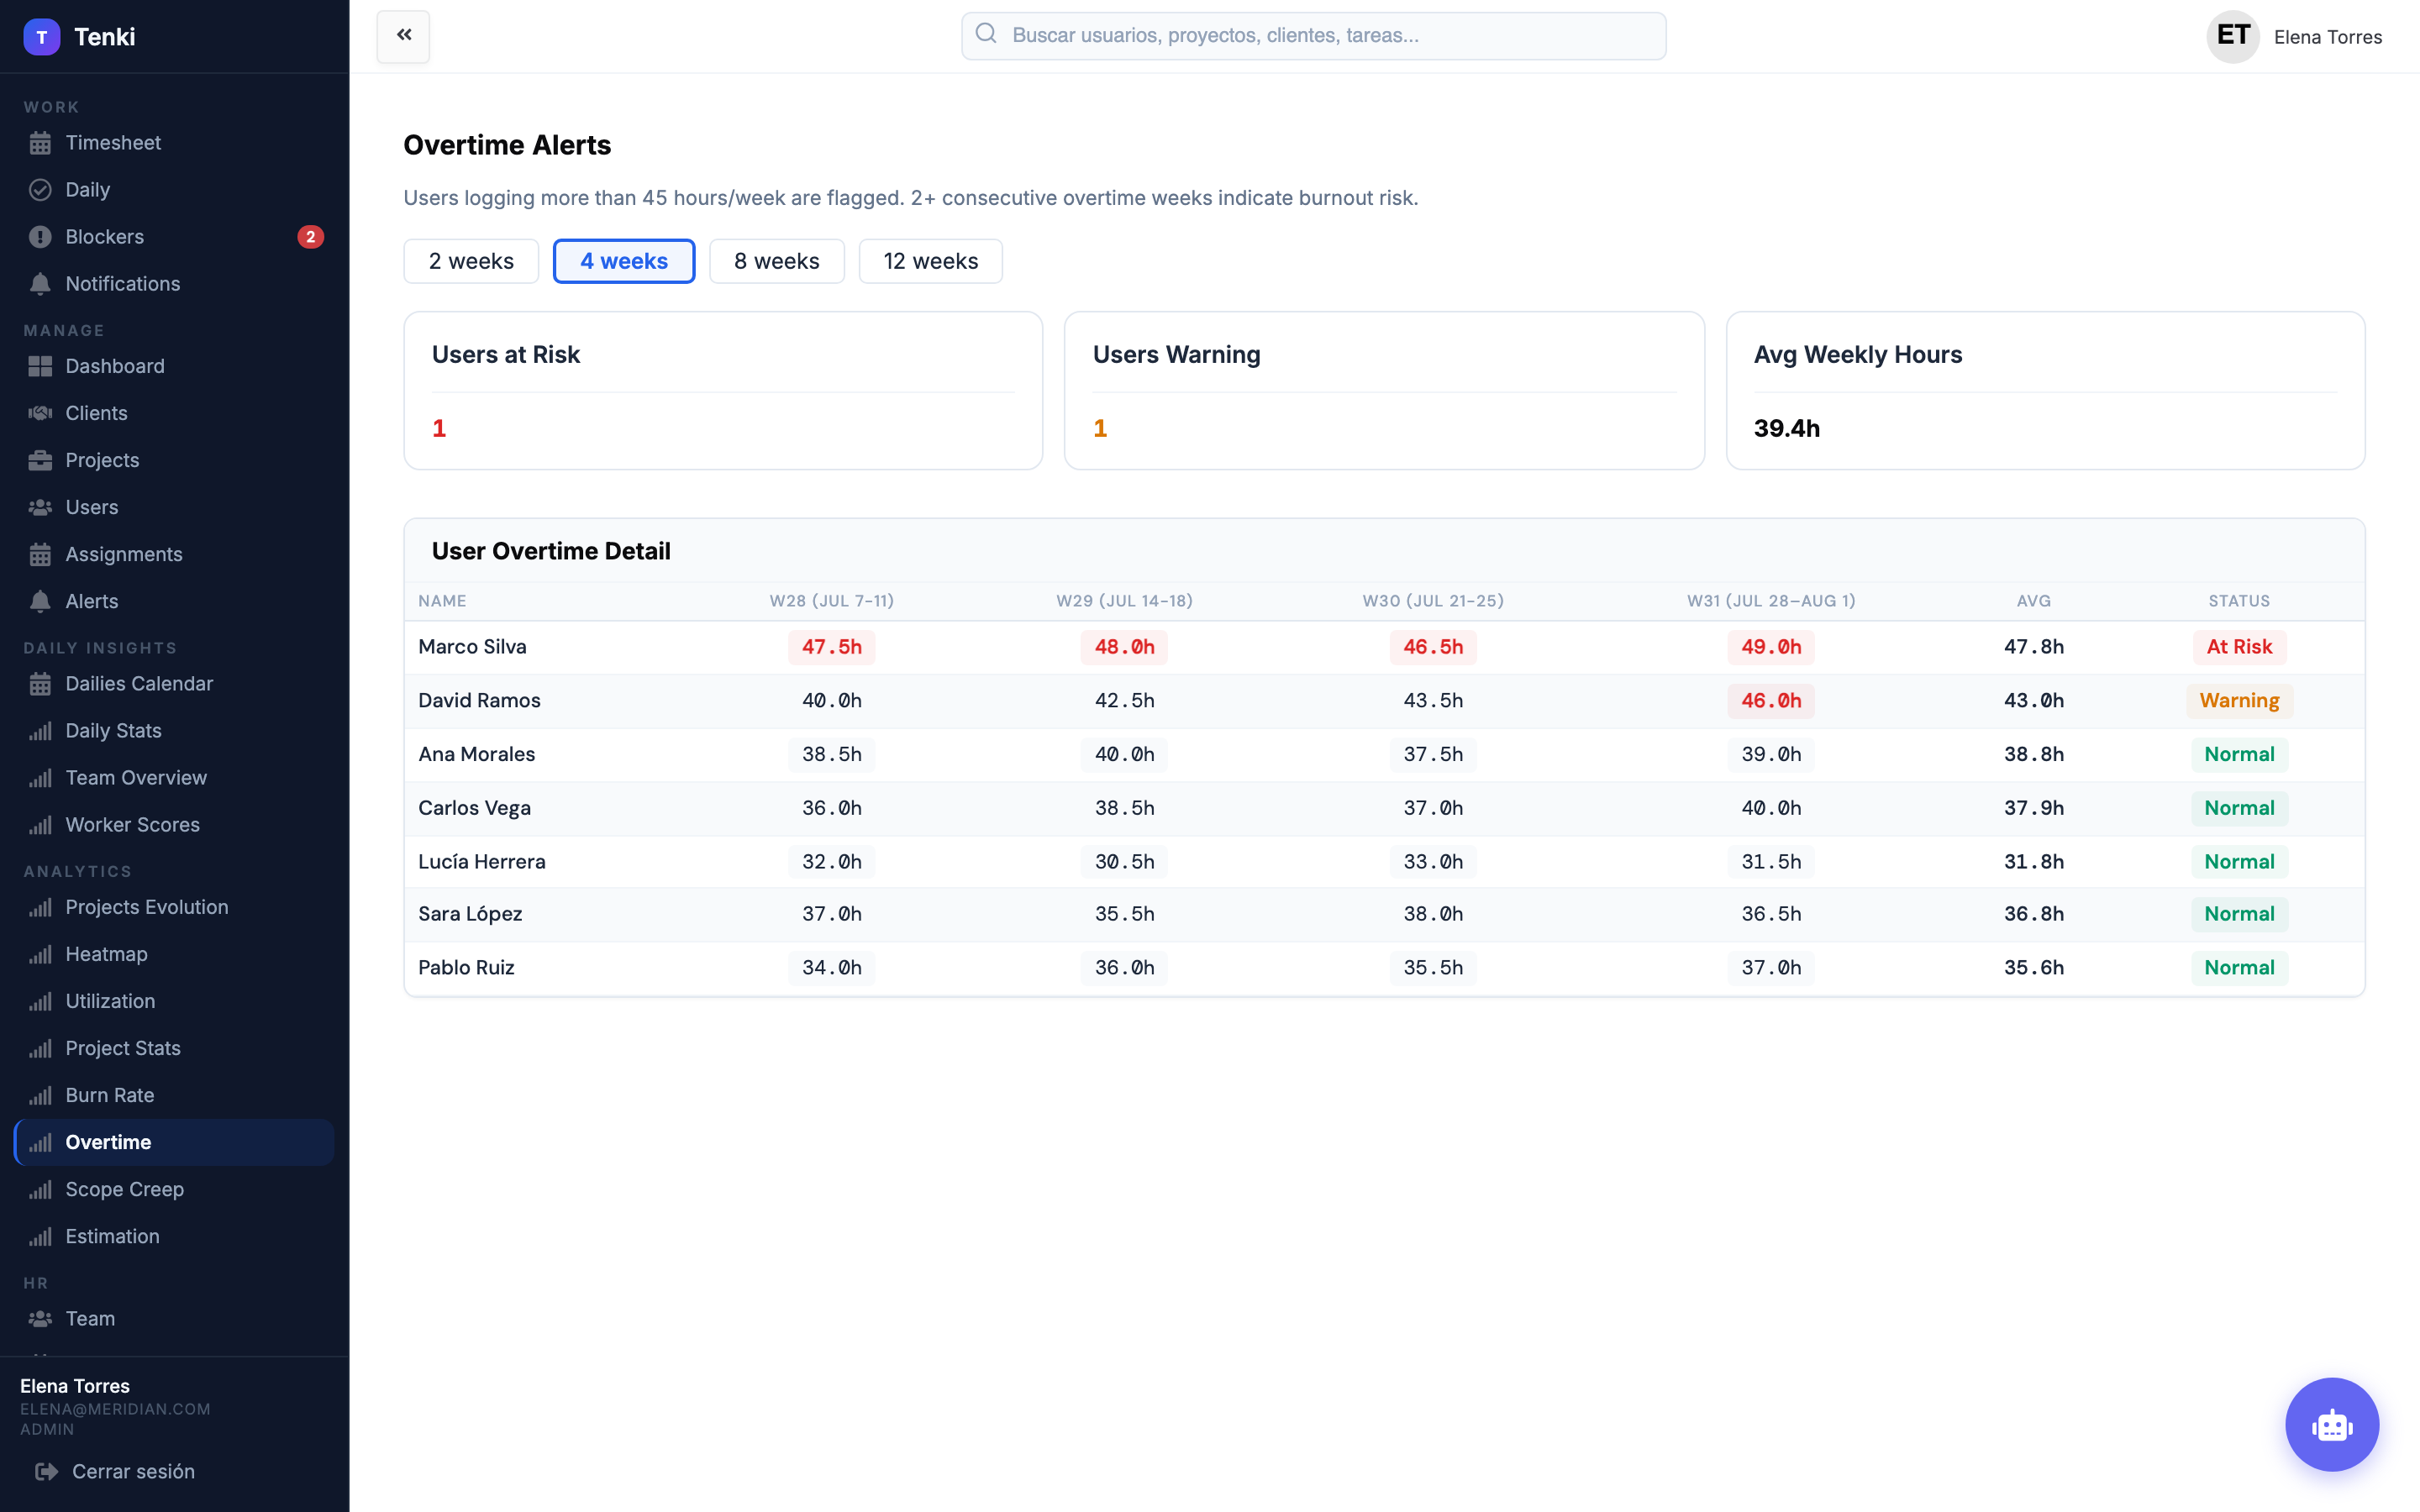
Overtime per person and period. Alerts when a legal or contractual limit is exceeded. History to spot trends. Prevent burnout with data, not hunches.
- Overtime per person
- Configurable legal alerts
- Trend history
- Export for HR
Frequently asked questions
Can I create custom metrics?
Can I export the data?
Who sees what?
Do alerts arrive by email?
How much history is kept?
Want to see the analytics in action?
We'll walk you through a demo in 15 minutes.