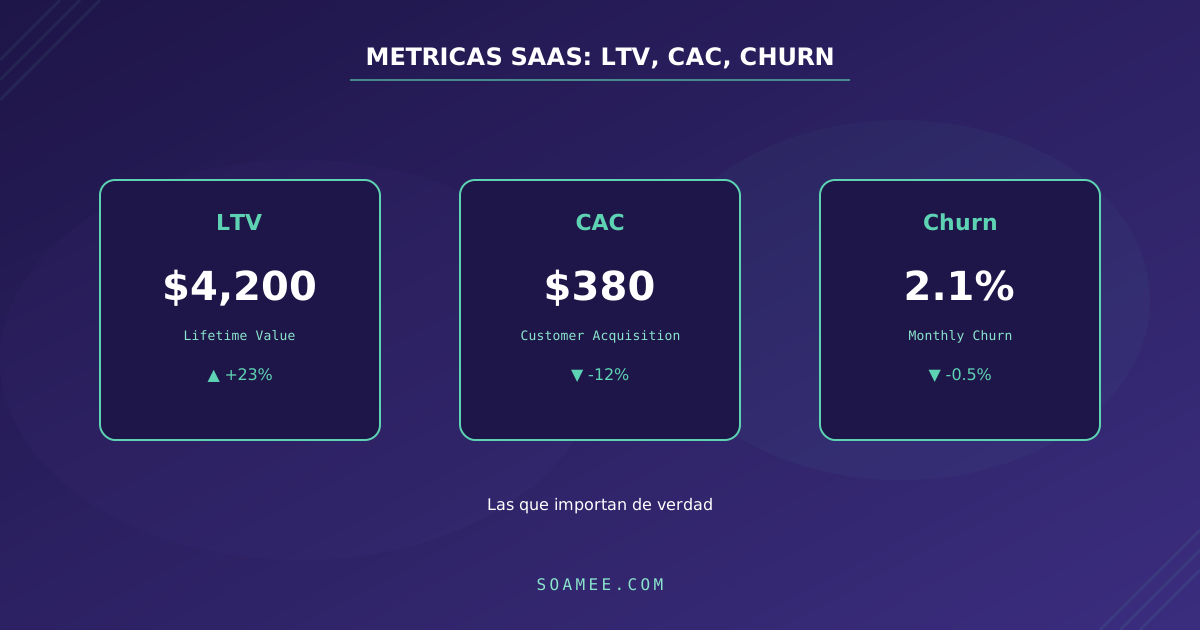
A SaaS can show you a beautiful dashboard — registered users, MRR climbing, charts going up and to the right — and be dying on the inside. It happens constantly: acquisition covers up the leak, aggregates hide the cohorts, and nobody has calculated CAC with salaries included. SaaS metrics exist to answer a single question: does this business make money on each customer, and how long does it take to make it?
In this guide we go through the ones that truly matter — MRR, churn, NRR, LTV, CAC — with the honest formulas, the usual traps, and indicative benchmarks to know whether your numbers are good or just pretty.
MRR and ARR: the starting point (and its four components)
MRR (Monthly Recurring Revenue) is your monthly recurring revenue; ARR is its annualized version (MRR × 12), common in B2B with annual contracts. Careful: only recurring revenue counts — setup fees, professional services, and one-off payments stay out.
The aggregate number says little. What is useful is breaking down each month’s movement:
- New MRR: new customers.
- Expansion MRR: existing customers paying more (upgrades, more seats, more usage).
- Contraction MRR: customers downgrading without leaving.
- Churned MRR: customers who leave.
Two companies with the same 10% monthly growth can be opposite businesses: one grows through expansion on a solid base; the other refills with new sales a bucket that loses 8% every month. The breakdown is what distinguishes growing from running on a treadmill.
Logo churn vs. revenue churn
There are two churns, and you should measure both:
- Logo churn: % of customers who cancel in the period.
- Revenue churn: % of MRR you lose to cancellations and downgrades.
They almost never match. If you lose 10 small 20 EUR customers but retain the 2,000 EUR ones, your logo churn can be high with irrelevant revenue churn — and the reverse: losing a single enterprise customer can sink your month. In SMB, logo churn rules (volume); in enterprise, revenue churn (concentration).
NRR: the king metric of B2B SaaS
NRR (Net Revenue Retention) answers this: of the customers you had 12 months ago, how much revenue do they generate today?
NRR = (starting MRR + expansion − contraction − churn) ÷ starting MRRAn NRR of 110% means you grow 10% per year without signing a single new customer: expansion outweighs all losses. That is why it is the metric that weighs most in B2B SaaS valuations — it summarizes retention, pricing, product, and customer success in one number.
Indicative public references: in SMB, an NRR of 90-100% is reasonable (expansion is hard with small tickets); in mid-market, 100-110% is good; benchmark enterprise SaaS exceed 120%. Below 80%, there is a product problem that no sales machine will compensate for.
LTV: the honest formula (and its traps)
LTV (lifetime value) estimates how much margin a customer leaves over their entire lifetime. The standard formula:
LTV = ARPA × gross margin ÷ monthly revenue churnExample: ARPA of 100 EUR/month, 80% gross margin, 2% monthly churn → LTV = 100 × 0.8 ÷ 0.02 = 4,000 EUR.
The three classic traps:
- Using historical churn instead of recent churn. If your churn has worsened, a two-year average gives you an inflated LTV. Use the last 3-6 months and, better yet, cohorts.
- Forgetting margin. LTV on revenue instead of gross margin overvalues the customer by 20-40%. What pays back your CAC is margin, not revenue.
- Very low churn rates that break the formula. With 0.5% churn, the formula assumes the customer lives 200 months (16 years). Nobody has data to support that: in those cases, cap the horizon at 4-5 years and accept the error.
CAC: count everything, not just the ads
CAC (customer acquisition cost) is total sales and marketing spend divided by the new customers in the period. The key word is total: marketing and sales team salaries, tools, agencies, content, and commissions — not just ad spend.
It is the most common mistake we see in audits: an “ads dashboard” CAC of 80 EUR that, with salaries and tools, is actually 350 EUR. With the first, the business looks profitable; with the second, every sale loses money for a year.
From there comes the second metric: CAC payback, the months it takes to recover CAC with the customer’s gross margin.
CAC payback = CAC ÷ (ARPA × gross margin)References: under 12 months is healthy in SMB; in enterprise, 18-24 months can be acceptable if NRR keeps up. Beyond that, you are financing growth with cash you may not have.
LTV/CAC ≥ 3: the rule, with nuances
The classic reference: LTV/CAC ≥ 3. Below 3, you earn too little per customer to cover the rest of the business; around 1, you lose money on every sale.
The nuances matter:
- An LTV/CAC of 8 is not always good news: it can mean you are underinvesting in growth when the market would let you accelerate.
- The ratio is only as reliable as its ingredients: with an LTV inflated by optimistic churn, a reported 3 can be a real 1.5.
- The ratio ignores time. An LTV/CAC of 4 with a 30-month payback can be worse than a 3 with an 8-month payback: the cash runs out before the LTV arrives.
Indicative benchmarks by segment
Generic ranges published in industry reports (OpenView, KeyBanc, ChartMogul). Indicative, not absolute truths:
| Metric | SMB | Mid-market | Enterprise |
|---|---|---|---|
| Monthly logo churn | 3-5% | 1-2% | <1% (measure annually) |
| Annual revenue churn | 30-50% | 15-25% | <10% |
| NRR | 90-100% | 100-110% | 110-125% |
| CAC payback | <12 months | 12-18 months | 18-24 months |
| LTV/CAC | ≥3 | ≥3 | ≥3 (with long cycles) |
Common mistakes when measuring a SaaS
| Mistake | Why it hurts | What to do |
|---|---|---|
| Vanity metrics (sign-ups, visits, cumulative users) | They always go up; they say nothing about whether the business works | Measure active, retained, and paying users |
| Averaging instead of cohorts | The aggregate mixes 2022 customers with yesterday’s and hides deterioration | Retention and churn curves by monthly cohort |
| Ignoring expansion | You only watch churn and miss half the picture | Measure NRR, not just gross retention |
| CAC without salaries | Understates the real cost by 2-4× | Include all sales and marketing spend |
| LTV with optimistic historical churn | Justifies CACs your cash cannot sustain | Recent churn, gross margin, capped horizon |
| Mixing recurring and non-recurring in MRR | Inflates the metric and breaks comparability | Subscription only; services separately |
Which metric to watch at your stage
Not every metric matters at once. The sensible sequence:
- Pre product-market fit: obsess over cohort retention. If the curve does not flatten, LTV is science fiction and optimizing CAC is accelerating in the wrong direction.
- Growth (traction and first channels): CAC payback rules. You are deciding where to invest every acquisition euro, and payback tells you which channels you can afford to scale.
- Scale: the king metric is NRR. At a certain size, growth depends more on expanding the installed base than on acquisition — and it is what will determine your valuation.
These metrics live inside a funnel
LTV, CAC, and churn do not float in a vacuum: they are the economic snapshot of what happens at each stage of the customer lifecycle. High churn is almost always an activation problem (the user never perceived the value); a runaway CAC is usually a channel or conversion problem. To diagnose where each number originates, the framework we use is the AARRR funnel and its pirate metrics: SaaS metrics tell you how much it hurts; the funnel tells you where.
And one precondition for everything: reliable data. Calculating NRR or CAC payback with broken tracking and out-of-sync spreadsheets is painting precision over noise. If your numbers change depending on who calculates them, instrument before you optimize — that is what we build metrics dashboards for with our data analytics service.
Conclusion
Five well-calculated numbers — MRR growth by component, revenue churn, NRR, honest LTV, and complete CAC with its payback — tell the truth about a SaaS better than fifty charts. The discipline is not in measuring more, but in measuring without self-deception: cohorts instead of averages, margin instead of revenue, salaries inside CAC.
If your metrics only go up and never make you uncomfortable, you are probably measuring the wrong ones.
Not sure your LTV/CAC would survive a due diligence? We audit your metrics and your funnel →